Table Of Content
Share this article:


Extract real-time Quick Commerce & FMCG data to boost pricing, trends, and sales insights.
Extract accurate Vacation Rental data with ease to track pricing, listings, and trends.
Get detailed Restaurant data like menus, ratings, and contacts with powerful extraction.
Efficiently extract Event and Meeting data for streamlined planning and insights.
AI-driven web scraping for accurate, automated data extraction—saving time & boosting insights.
Extract data tailored to your unique business needs with custom solutions.
Scrape data from mobile apps for detailed insights and competitor analysis.
Access structured web data effortlessly using our smart Web Scraping API solution.
Develop scalable web crawlers for fast, automated, and efficient data collection.
Extract real-time data from dynamic websites for timely insights and market advantage.
Track competitor pricing trends and stay ahead with smart Price Monitoring Services.
Track and analyze your brand's online presence to enhance reputation and drive growth.
Accurately match identical products across platforms to boost sales and visibility.
Transform your data into insightful visuals for better decision-making and analysis.
Extract and analyze online data with powerful Web Data Mining for smarter decisions and competitive growth.
Understand customer opinions and feedback with accurate Sentiment Analysis solution.
Monitor product visibility, pricing, and performance across online stores with advanced Digital Shelf Analytics solutions.
Boost data accuracy and efficiency with machine learning-based web scraping for smart automation.
High-quality AI training datasets for accurate models, automation, and smarter insights.
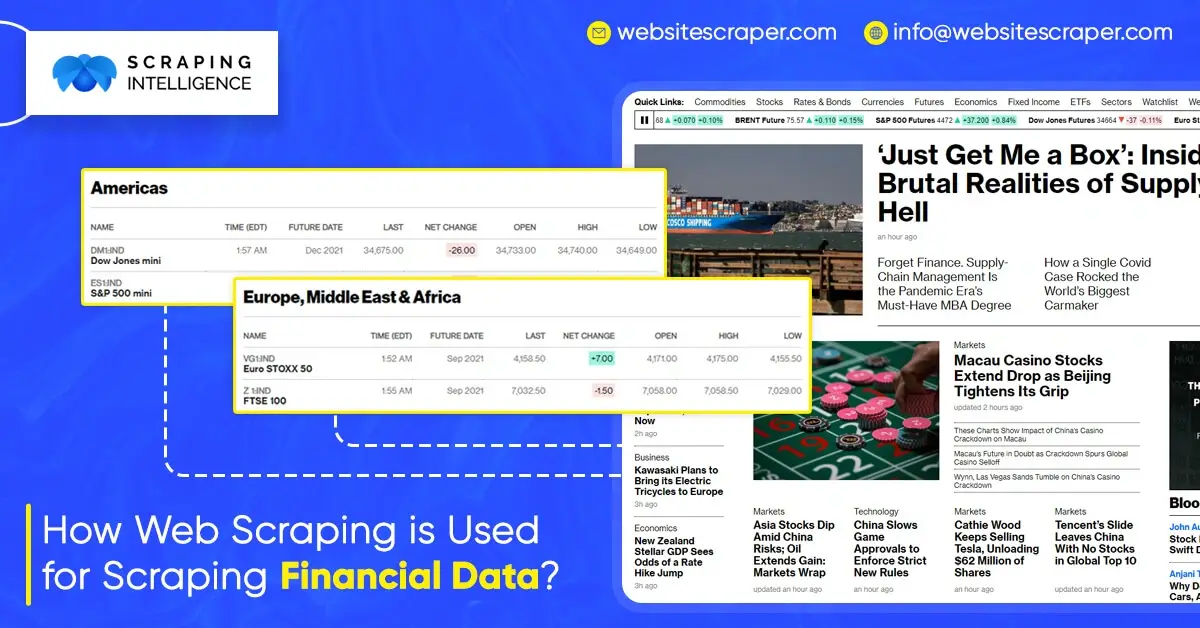
There aren’t a lot of data science applications in accounting. Accounting jobs, on the other hand, are among the more time-consuming sectors that should be automated. You can collect financial accounts for individual companies so that they can compare their performance with the other companies.
Manipulation of web data can be challenging at times, particularly when the site is changed, but learning these web scraping service procedures will save you a lot of time in the long run. Here’s an example of using Python to get financial statements of Yahoo Finance by finance data scraping.
Urlib.request is indeed an open-source library for parsing webpage content. When you dial that number, you’re simply asking the website to retrieve data from it. If you’re interested, here’s some more information.
https://docs.python.org/3/library/urllib.request.html
Beautiful Soup is another library that makes viewing saved data in XML format easier. XML is a comparable format to HTML that allows you to store information between tags. When you open it, it appears to be a bit jumbled. Just like when you download a webpage’s source code.
import pandas as pd
from bs4 import BeautifulSoup
import urllib.request as ur
Here’s a quick tip for adjusting the company name and plugging it into the URL link. It will come in helpful later if you need to retrieve hundreds of financial statements from different companies.
# Enter a stock symbol
index= ‘MSFT’# URL link
url_is = ‘https://finance.yahoo.com/quote/' + index + ‘/financials?p=’ + index
url_bs = ‘https://finance.yahoo.com/quote/' + index +’/balance-sheet?p=’ + index
url_cf = ‘https://finance.yahoo.com/quote/' + index + ‘/cash-flow?p=’+ index
We’ve now saved the URL link. It will look like this if you manually open them in a Web browser.
After that, all we have to do is access the link and convert it to the right lxml format. It’s that simple.
read_data = ur.urlopen(url_is).read()
soup_is= BeautifulSoup(read_data,’lxml’)
Because the elements were initially in HTML format, when you open soup is, it will look like a jumble. All elements are systematically organized into classes.
They are stored in “div” after a few searches, so it is possible to construct an empty list and use a for loop to find and append all elements to the list.
ls= [] # Create empty list
for l in soup_is.find_all(‘div’):
#Find all data structure that is ‘div’
ls.append(l.string) # add each element one by one to the list

ls = [e for e in ls if e not in (‘Operating Expenses’,’Non-recurring Events’)] # Exclude those columns
There are a lot of “none” elements in ls because not all “div” has an element. They just need to filter.
new_ls = list(filter(None,ls))
It will result into
If you go one step further, you can begin reading the list from the 12th spot.
new_ls = new_ls[12:]
To create a data frame, we must iterate six objects at a moment and save them as an item set. However, we require a list in order for the panda’s library to convert it into a data frame.
is_data = list(zip(*[iter(new_ls)]*6))
Perfect, that’s exactly what we’re looking for. All that’s left is to read it into a data frame.
Income_st = pd.DataFrame(is_data[0:])
The first row should be read as the column, and the first column should be read as the row index. Here’s a list of things that need to be cleaned up.
Income_st.columns = Income_st.iloc[0]
# Name columns to first row of dataframeIncome_st = Income_st.iloc[1:,]
# start to read 1st rowIncome_st = Income_st.T # transpose dataframeIncome_st.columns = Income_st.iloc[0]
#Name columns to first row of dataframeIncome_st.drop(Income_st.index[0],inplace=True) #Drop first index rowIncome_st.index.name = ‘’
# Remove the index nameIncome_st.rename(index={‘ttm’: ‘12/31/2019’},inplace=True)
#Rename ttm in index columns to end of the yearIncome_st = Income_st[Income_st.columns[:-5]]
# remove last 5 irrelevant columns
Your Data Frames should look like this after applying the same principles to the income statement, balance sheet, and cash flow.
DateTime becomes a row index once the DataFrames are transposed, and the features become column names.
Feel free to ask any questions, contact Scraping Intelligence today!!

Zoltan Bettenbuk is the CTO of ScraperAPI - helping thousands of companies get access to the data they need. He’s a well-known expert in data processing and web scraping. With more than 15 years of experience in software development, product management, and leadership, Zoltan frequently publishes his insights on our blog as well as on Twitter and LinkedIn.
Explore our latest content pieces for every industry and audience seeking information about data scraping and advanced tools.
Learn how to scrape Amazon Best Sellers using Python with working code, pagination handling, data export tips & ways to avoid getting blocked on Amazon.

Learn how to build a custom content aggregator using web scraping with Python, data storage, and automation to collect and manage content easily.
Learn how to extract restaurant listings data from OpenTable using Python and automation to collect menus, ratings, pricing, and booking info.
Beat European competition by using TikTok Shop scraping to collect product, pricing & trend data, spot top items, track competitors, and grow in Europe.