How US Restaurant Chains Use Menu Price Data to Protect Margins as Food Costs Rise
Category
Food & Restaurant
Publish Date
Oct 05, 2026
Author
Scraping Intelligence
Introduction
US restaurant prices rose 3.4% through August 2026, according to Bureau of Labor Statistics CPI data. That adds to the pressure restaurant chains already face from higher ingredient, labor, and operating costs. Raising menu prices is the obvious response, but customers notice quickly, and even a small increase can push them toward cheaper options or fewer visits.
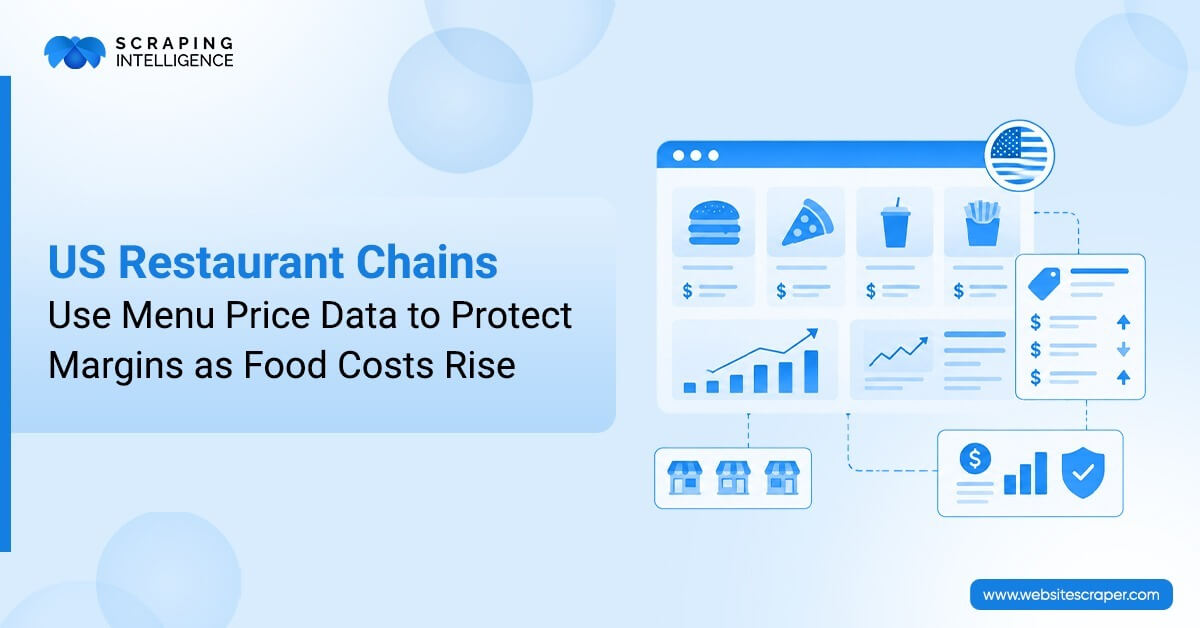
So how do chains protect margins without driving customers away? Increasingly, the answer is restaurant menu price data. By tracking what competitors charge, how they discount, and how prices differ by city and location, operators can replace guesswork with a clear view of the market. They can see where they can raise prices, where they need to hold the line, and which promotions are still worth running.
Why Rising Food Costs Are Pressuring Restaurant Margins
For restaurant chains, rising food costs can quickly turn a profitable menu into a margin problem. When the price of chicken, beef, dairy, fresh produce, or cooking oil goes up, so does the cost of every dish that uses it. For high-volume chains serving thousands of customers across many locations, even a small per-plate increase adds up fast.
Commodity swings, transportation costs, supplier pricing, and supply disruptions add further pressure. Yet passing every extra cost straight to customers can backfire if they trade down or order less often.
Inflation affects more than the menu board. It squeezes portion economics, erodes the profitability of individual items, and makes discounts more expensive to run. At the same time, customers become more price-sensitive and respond differently to promotions. That is why chains need to understand both their internal costs and the pricing moves happening across the market.
What Is Menu Price Data for Restaurants?
Menu price data is structured information collected from restaurant menus across websites, ordering apps, and food delivery platforms. It typically includes item names, prices, descriptions, portion sizes, categories, discounts, combo offers, add-ons, availability, and location-specific pricing.
Collected at scale and over time, this raw data becomes menu price intelligence: a view of how prices differ across competitors, cities, individual stores, and time periods. Instead of relying on occasional manual checks, chains can use it to make better decisions about pricing, promotions, and item profitability.
How Restaurant Chains Use Menu Price Data to Protect Margins
Protecting margins is not about raising prices whenever costs rise. It requires knowing where you stand against competitors, how local markets differ, and how each item actually performs. Here are the five main ways chains put menu data to work.
Track Competitor Menu Prices
Comparing similar dishes across competing brands shows which of your items are priced above or below the market. Tracking competitor increases over time also reveals how other chains are reacting to the same cost pressures. For the most useful benchmarks, segment these comparisons by city, region and restaurant format.
Monitor Promotional Pricing
Promotions shape both demand and margins. Tracking competitors’ discounts, combo offers, limited-time deals and coupons show how they attract price-sensitive customers without permanently cutting prices. Comparing promotional prices with regular menu prices also reveals how deep their discounts really go, and how your own offers stack up.
Identify Regional Pricing Differences
A price that works in one market may fail in another. Comparing prices across locations shows how local competition, rent, labor costs and spending patterns shape pricing. This helps operators find markets where an increase is realistic, instead of applying a blanket increase that does not suit every location.
Measure Price Changes Over Time
A single snapshot tells you very little. Historical menu price data shows how competitor prices evolve and how often they change. That makes it easier to separate gradual increases from sudden jumps and to spot recurring patterns. Viewed alongside food-cost trends, this history helps you decide when to revisit your own prices.
Combine Price Data with Cost Data
Menu price data becomes far more powerful when paired with your own ingredient and operating costs. Together, they show the true margin on each item, highlight high- and low-margin products, and reveal opportunities for price adjustments, bundles, meal combos or add-ons.
A Quick Example: Pricing a Chicken Sandwich
Imagine a quick-service chain whose chicken costs have risen 8% over the year. Rather than raising its chicken sandwich price everywhere, it pulls competitor menu data for two markets. The figures below are illustrative.
Market
Our Price
Competitor Average
Gap
Dallas
$6.49
$6.99
–$0.50 (below market)
Chicago
$7.29
$7.19
+$0.10 (at market)
The data points to a targeted move. In Dallas, the chain has room to raise the price by around $0.40 and still sit below competitors. In Chicago, it is already at market, so it holds the price and protects margin through a combo that pairs the sandwich with a higher-margin drink. The result is better margins in both markets without a blanket increase.
Turning Menu Data into Pricing Decisions
Food cost inflation hits every chain differently. The same rise in chicken or beef prices has a different impact depending on menu mix, supplier contracts, portion sizes and local operating costs. That is why internal cost reports alone are not enough.
By combining competitor pricing with internal food-cost and sales data, chains can decide which items to reprice, promote, bundle or leave alone. They can see where a modest increase will offset rising costs, where value pricing must be protected, and whether a promotion still earns an acceptable margin. Historical data adds another layer, letting operators adjust at the item or store level instead of across the whole menu.
Why Automated Tracking Beats Manual Price Checks
Manual price tracking usually means staff checking competitor websites, delivery apps or individual stores. It provides a basic snapshot, but it becomes impossible to maintain as the number of competitors, locations and menu items grows. Automated tracking gives chains a broader, more consistent and more frequent view.
Manual Approach
Automated Approach
Manual menu checks
Automated data collection
Occasional price checks
Daily or weekly monitoring
A few competitors
Many competitors
Individual locations
Multi-location analysis
Current prices only
Historical price trends
Basic price comparison
Pricing and promotional intelligence
The difference comes down to scale, frequency and depth. Instead of glancing at a handful of menus now and then, chains can track many brands across cities and stores on a fixed schedule, and spot trends rather than just today’s changes.
What Key Metrics Should Restaurant Chains Track?
Raw data becomes useful once you turn it into metrics. Some come straight from competitor menu data, while others need your own cost and sales figures.
From menu price data
Average Menu Price: Typical selling price across items or markets.
Price Change Percentage: How much an item’s price has increased or decreased.
Competitor Price Gap: The difference between your price and comparable competitor prices.
Promotional Discount Rate: The average discount across competitor deals.
Price Index by Market: Relative price levels across cities or regions.
Price Variance by Location: How much prices differ between stores.
Price Change Frequency: How often competitors update their prices.
From your internal data
Food Cost Percentage: The share of menu revenue spent on ingredients.
Gross Margin per Item: Profit on each item after direct costs.
Item-Level Profitability: Profit per item based on price, cost and sales volume.
Tracking both sets together moves chains beyond simple price comparisons toward real margin decisions.
How Automated Menu Price Data Collection Works?
Automated collection uses web scraping and data extraction to gather menu prices on a regular schedule. A reliable setup covers several things that manual checks miss.
Multiple sources: Chain websites, mobile ordering apps, and delivery platforms such as DoorDash, Uber Eats and Grubhub.
Channel separation: Delivery-app prices are often higher than in-store prices, so good data keeps each channel separate to avoid misleading comparisons.
Location-level coverage: Chain prices often vary by store, so we collect data by ZIP code or store ID rather than once per brand.
Item matching and normalization: Comparing a "chicken sandwich" across brands means mapping different names, sizes and combo structures to like-for-like items.
Freshness and quality checks: Data is refreshed daily or weekly and validated for missing items, errors and duplicate entries.
The cleaned data is stored centrally and delivered in the format your team uses, whether that is CSV files, an API feed or a dashboard. Your pricing team can then track competitors, compare markets and spot changes without hours of manual checks.
Final Thoughts
Rising food costs keep margins under pressure, but across-the-board price increases are not the only answer. Chains that track competitor prices, promotions and regional differences, and combine them with their own cost data, can make targeted pricing moves that protect profit without losing customers.
Scraping Intelligence collects menu prices, promotions and location-level pricing from restaurant websites and delivery apps, delivered as clean data through an API, files or a dashboard. Tell us which competitors and markets you want to track, and we’ll set up a feed that fits your pricing workflow.
Frequently Asked Questions
Is it legal to scrape restaurant menu prices?+
Collecting publicly available pricing information is common practice, but rules vary by website and jurisdiction. A responsible provider respects site terms, avoids personal data, and collects only public menu information. For specific use cases, check with your legal team.
How often should menu prices be tracked?+
Weekly tracking suits most chains. Daily tracking is useful during periods of fast price changes, major promotions, or new product launches.
Why do delivery app prices differ from in-store prices?+
Many restaurants set higher prices on delivery platforms to offset commission fees. That is why you should track and compare delivery and in-store prices separately.
Share this article:
About the Author
Scraping Intelligence
Scraping Intelligence Editorial Team is a collective of data specialists, analysts, and researchers with expertise in web scraping, data extraction, and market intelligence. The team produces well-researched guides, actionable insights, and industry-focused resources that help businesses unlock the value of data and make informed, strategic decisions.
Latest Blog
Explore our latest content pieces for every industry and audience seeking information about data scraping and advanced tools.
Discover how real estate web scraping helps agents, investors & brokers extract listings, prices & market trends. See 7 key benefits of real estate data scraping.
Discover how AI-powered web scraping is transforming data extraction with LLMs, machine learning, automation, real-time data, and intelligent web crawling.