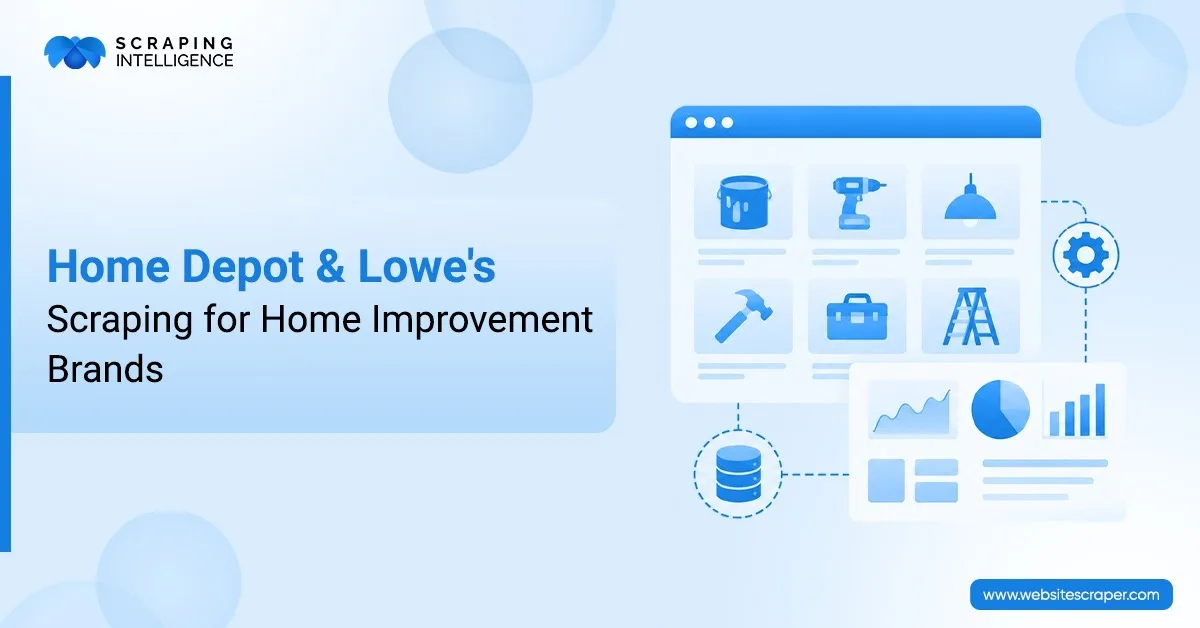
Home Depot & Lowe’s Data Scraping for Home Improvement Brands
Category
E-commerce & Retail
Publish Date
Oct 26, 2026
Author
Scraping Intelligence
The United States home improvement market is worth more than $500 billion, and two retailers shape most of it. Home Depot and Lowe's set the prices, promotions, and shelf visibility that your paint, tools, flooring, or fixtures live or die by every single day. Because those prices and offers change so often, manual competitor tracking has quietly become a losing game, and that is exactly where Home Depot data scraping earns its place in a modern strategy.
This guide covers what data you can collect, how a retail monitoring workflow runs, which categories to watch first, and when it makes sense to build in-house or hire a partner.
What does Home Depot data scraping actually mean?
In plain words, web scraping is an automated way of reading public product pages and saving the details into a clean, structured file. Rather than one person copying prices into a sheet for hours, a scraper gathers thousands of records in minutes. When you scrape Home Depot prices alongside specifications, stock status, and ratings, you build a living database that mirrors what shoppers actually see at the moment of purchase.
The same method works on Lowe's, so your view of the category stays complete instead of one-sided. Pulling Lowe's product data next to Home Depot figures lets you compare both giants under one roof, which is where the real insight sits. For brands that want this handled reliably at scale, professional retail data scraping services take care of the collection, the formatting, and the ongoing upkeep.
What data can you pull from these retailers?
A single product page holds far more than a price tag, and the fields together form the backbone of accurate competitor tracking. The rebuilt table below shows the records home improvement brands rely on most.
Data field
Why it matters
Product title
Product matching and catalog comparison
SKU / model number
Cross-retailer product matching
Current price
Core of competitive price monitoring
Original / list price
Discount and promotion analysis
Promotion details
Tracking sales, coupons, and bundle offers
Stock status
Availability signals by store and region
Ratings and reviews
Shopper sentiment versus your rivals
One table keeps the picture simple, yet the combinations create the edge. A price feed alone is helpful, but a price feed paired with stock status and review counts tells a far richer story about the market.
Home Depot vs. Lowe's: the figures that matter
The two chains look alike from the parking lot, yet their scale and shopper mix differ in ways that shape your plan.
Home Depot closed fiscal 2025 with roughly $164.7 billion in sales across about 2,359 U.S. stores, which keeps it the largest home improvement retailer worldwide.
Lowe's posted close to $86 billion in revenue from around 1,750 stores, with each store stocking about 40,000 items.
Lowe's leans heavily toward DIY shoppers, at roughly 70% of sales, while Home Depot carries a stronger professional base.
What this means for your brand is simple. A combined program covering both retailers is the only way to see the full category, and that complete view is what makes Lowe's product data and Home Depot figures so powerful when read together.
How does a retail monitoring workflow run?
A reliable program takes more than pointing a scraper at a page. It starts with scope. You decide which retailers, categories, products, and store locations are worth watching, and which fields actually earn their place in the report. Once that is set, an automated pipeline does the collecting, pulling prices, promotions, stock status, specs, and product identifiers on whatever schedule the category demands.
Raw records are messy, though, so the next job is cleanup. Prices, product names, units, and categories all get standardized, because Home Depot and Lowe’s rarely format anything the same way. After that comes the part most teams underrate: matching. A drill on one site has to be tied to the same drill on the other, using SKU, model number, brand, and specifications rather than guesswork.
Nothing should reach a dashboard before it has been checked. A good validation passes catches missing fields, strange values, duplicate rows, and bad matches that would otherwise skew the numbers. Only then does the clean data get delivered, flowing into the dashboards, databases, spreadsheets, or API your team already works in.
Which categories deliver the fastest wins?
Not every category deserves equal attention on day one, and a focused start usually beats a broad one. Power tools, major appliances, and seasonal lines tend to show the quickest returns, mainly because their prices move often and shoppers compare them closely. A cordless drill or a patio set can swing in price several times a month, so early tracking gives a real read on demand. A sensible approach is to pick ten to fifteen high-traffic SKUs, run monitoring on them for a few weeks, and watch where the movement sits. Once that pattern is clear, scaling your Home Depot data scraping across more categories feels natural rather than forced.
How can brands use this data?
Clean data only earns its keep once it changes what your team actually does. Here is where DIY retail analytics stops being a report and starts being a decision.
Price positioning. Your rates sit next to both retailers at a glance, and nothing drifts out of line without you catching it early.
Promotion tracking. The moment a rival drops a discount, you see it. No more hearing about it from a sales dip three days later.
Assortment gaps. Rivals stock plenty of products your brand has not picked up yet. A clean feed makes those holes obvious.
Demand signals. An item that keeps selling out across stores is rarely random. That pattern usually points to rising interest.
Share of search. This one shows how often your listings actually surface against competing products when a shopper runs a query.
What separates good data from bad data?
Two programs can collect the same listings and still produce very different results, and the gap almost always comes down to quality rather than volume. Three traits divide the strong feeds from the weak ones.
Freshness, where prices reflect today instead of last week, because stale numbers lead to decisions that were wrong before anyone acted on them.
Accuracy, meaning each record ties to the correct SKU and store, since a single mismatch can quietly skew an entire report.
Completeness, where nothing important is missing, because stock status without a review count leaves half the picture gone.
When these three hold together, your Lowe's product data becomes something the whole team can trust. Good data earns that trust slowly yet loses it fast, so these checks are worth running on every pull.
Should you build in-house or hire a partner?
A fair question at this stage is whether to build the system yourself or bring in a specialist, and both paths suit different teams. In-house scripts make sense when the scope is small, the budget is tight, and you have engineers who genuinely enjoy maintenance. The catch is that retailer sites change their layouts often, and broken scrapers tend to fail quietly until a report looks strange.
A managed partner fits brands that want dependable data without owning the upkeep, since the provider absorbs blocks, site changes, and scale. When monitoring thousands of products across several categories would eat more engineering time than you can spare, a team like Scraping Intelligence can own the collection and maintenance layer for you.
Manual checks become a problem the moment pricing moves faster than your team can review it. A few clear signals suggest the timing is already right.
Surprise discounts from rivals that your team hears about from customers rather than from data.
Slipping margins on key products without any clear reason behind the drop.
Hours lost to manual price checks that still miss the fastest changes.
New competitor products on the shelf well before your own buyers flag them.
If two or more of these feel familiar, structured home improvement price monitoring is likely overdue, and early tracking almost always costs less than a late scramble.
Conclusion
The home improvement category is simply too large and too competitive to run on guesswork. With dependable Home Depot data scraping, clear Lowe's product data, and disciplined home improvement price monitoring, your brand gains the visibility that makes every pricing and stocking call sharper. The data already sits in plain sight, so the real question is whether your team reads it before your competitors do.
If you are ready to turn shelf data into a lasting edge, the specialists at Scraping Intelligence can design a custom pipeline around your exact categories, retailers, and reporting needs. Reach out through Scraping Intelligence, share your goals, and let strong DIY retail analytics start working for your brand this quarter.
Let's Talk About Your Data Needs
Tell us what data you need, and we'll help you find the right solution.
Scraping Intelligence Editorial Team is a collective of data specialists, analysts, and researchers with expertise in web scraping, data extraction, and market intelligence. The team produces well-researched guides, actionable insights, and industry-focused resources that help businesses unlock the value of data and make informed, strategic decisions.
Latest Blog
Explore our latest content pieces for every industry and audience seeking information about data scraping and advanced tools.
Compare real estate data APIs vs. web scraping costs, including setup, infrastructure, maintenance, and data quality, to find the right solution for your needs.